
A thermodynamic cycle xyzx is shown on a V-T diagram.
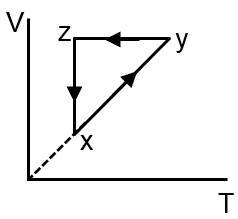
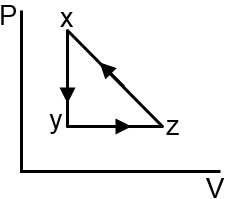
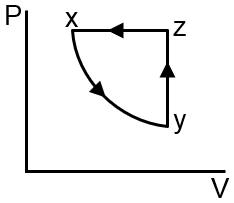
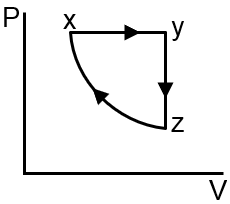
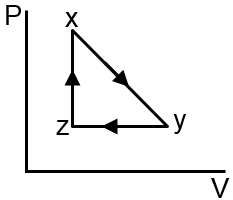
The P-V diagram that best describes this cycle is: (Diagrams are schematic and not to scale)

Know your College Admission Chances Based on your Rank/Percentile, Category and Home State.
Get your JEE Main Personalised Report with Top Predicted Colleges in JoSA
The V-T diagram shows process x→y at constant volume (V constant, T increases → P increases), y→z at constant temperature (T constant, V decreases → P increases), and z→x at constant pressure (P constant, V decreases → T decreases).
For an ideal gas, P = nRT/V. Process x→y is isochoric: . y→z is isothermal: . z→x is isobaric: .
The correct P-V diagram must show: constant volume line (vertical) for x→y, hyperbolic curve for y→z (isothermal compression), and straight line through origin for z→x (isobaric).
Final Answer: The second option.