
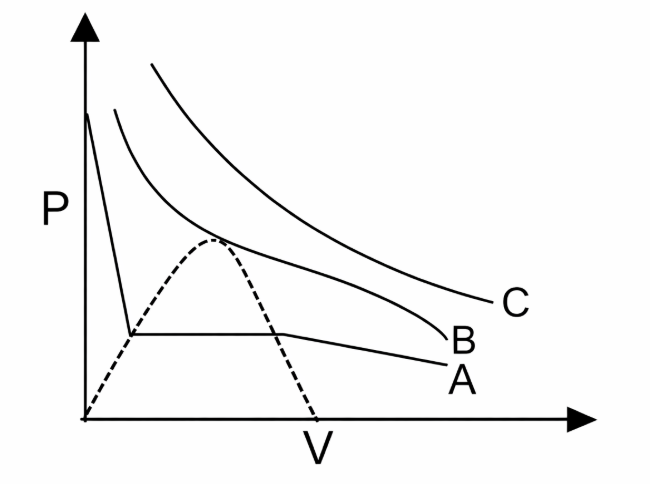
For three different real gases, liquifaction curve is plotted at a temperature T1 Kelvin. Which of the following options is correct on the basis of the graph?

Know your College Admission Chances Based on your Rank/Percentile, Category and Home State.
Get your JEE Main Personalised Report with Top Predicted Colleges in JoSA

The graph shows liquefaction curves for gases A, B, and C at temperature T₁. A gas can be liquefied by pressure only if its temperature is below its critical temperature (TCr). The curve's position indicates TCr; a higher curve means a higher TCr. From the graph, the order is C (highest curve) > B > A (lowest curve). Therefore, at T₁, which is below all their TCr values, all can be liquefied. However, only gas C, with the highest TCr, could potentially be liquefied at a temperature greater than T₁, as its TCr is the highest.
Final Answer: Gas 'C' can be liquified by application of pressure at a temperature greater than T₁.