
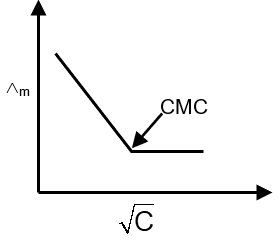
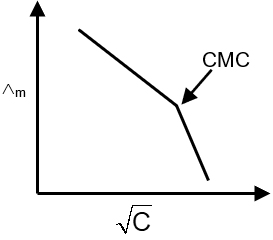
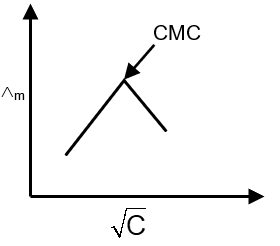
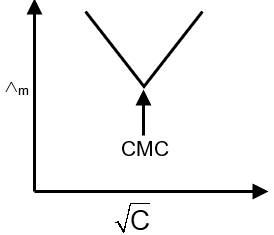
Molar conductivity (⋀m) of aqueous solution of sodium stearate, which behaves as a strong electrolyte, is recorded at varying concentration(C) of sodium stearate. Which one of the following plots provides the correct representation of micelle formation in the solution ?
(Critical micelle concentration (CMC) is marked with an arrow in the figures.)

Know your College Admission Chances Based on your Rank/Percentile, Category and Home State.
Get your JEE Main Personalised Report with Top Predicted Colleges in JoSA
Molar conductivity (Λm) decreases with concentration for strong electrolytes due to increased ion interactions. For surfactants like sodium stearate, micelle formation occurs above the Critical Micelle Concentration (CMC). Below CMC, Λm decreases gradually with √C. Above CMC, micelles form, reducing the number of charge carriers, causing a sharp drop in Λm. The correct plot shows a gradual decrease followed by a sudden steep decline at CMC.
Final Answer: The plot showing a sharp drop in Λm at CMC (likely the second or third option, but the description matches the typical behavior).