
Engineering
Physics
Bohrs Model of Atom
Question
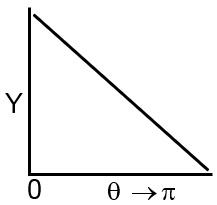
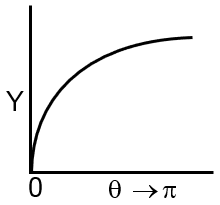
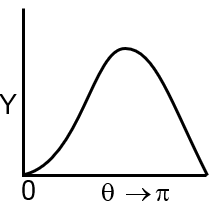
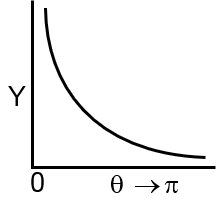
The graph which depicts the results of Rutherford gold foil experiment with α-particles is α-particles is:
Y = Number of scattered a-particles detected
(Plots are schematic and not to scale)

Know your College Admission Chances Based on your Rank/Percentile, Category and Home State.
Get your JEE Main Personalised Report with Top Predicted Colleges in JoSA
Solution