
Engineering
Physics
Maxwells Distribution Curve and Vrms Vav Vmp
Question
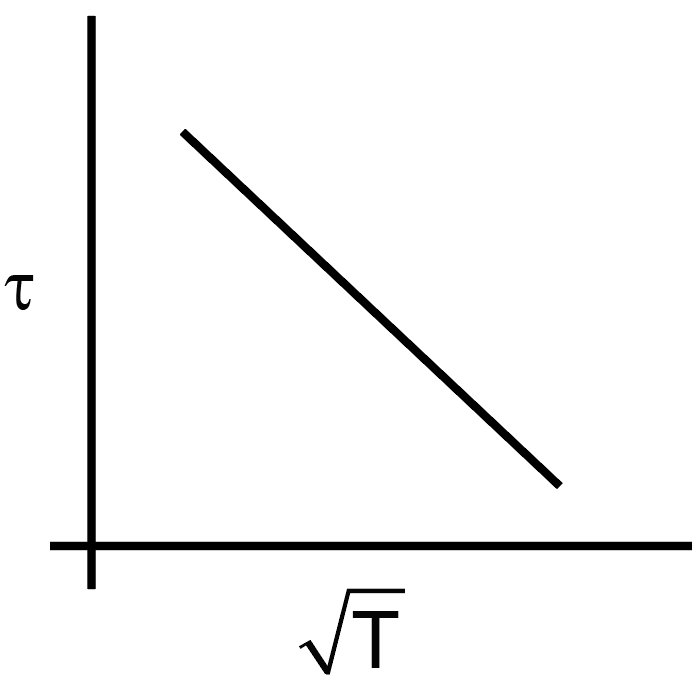
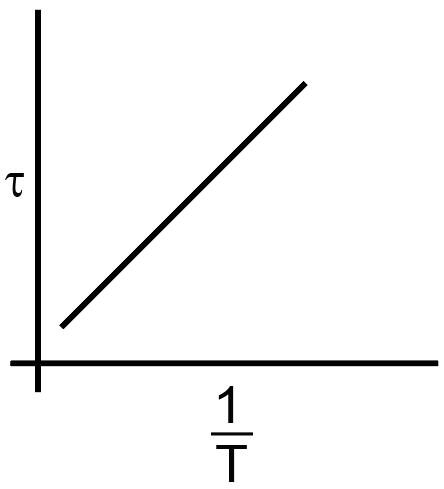
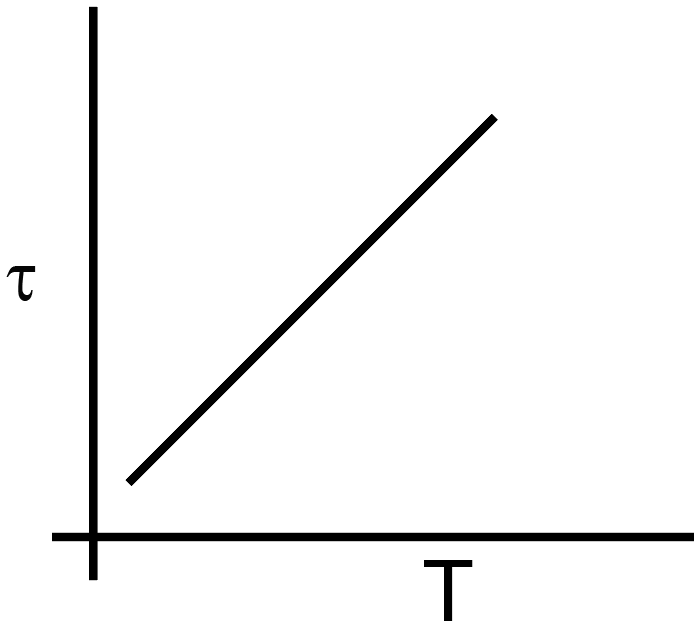
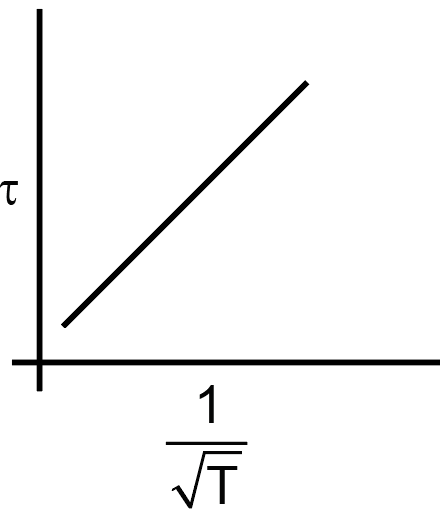
The plot that depicts the behaviour of the mean free time τ (time between two successive collisions) for the molecules of an ideal gas, as a function of temperature (T), qualitatively, is: (Graphs are schematic and not drawn to scale)

Know your College Admission Chances Based on your Rank/Percentile, Category and Home State.
Get your JEE Main Personalised Report with Top Predicted Colleges in JoSA
Solution