
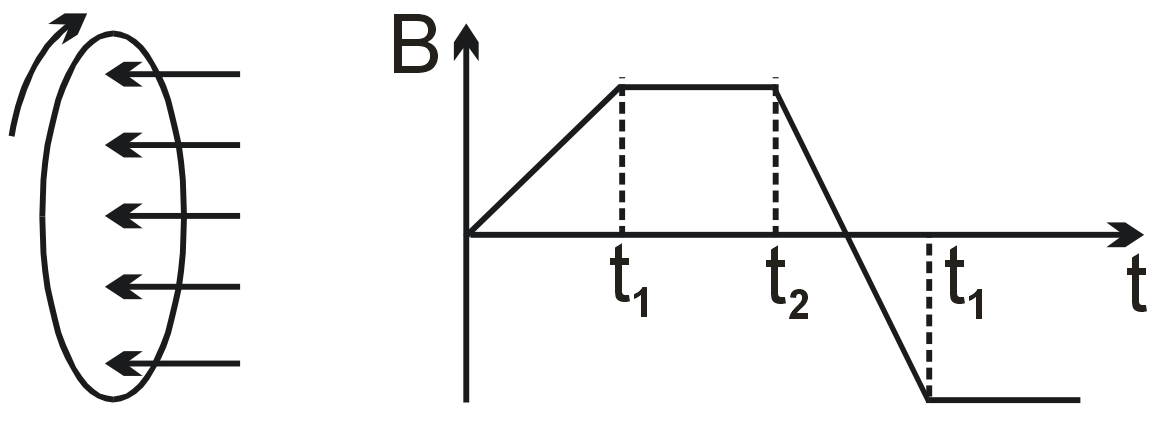
A wire loop is placed in a region of time varying magnetic field which is oriented orthogonally to the plane of the loop as shown in the figure. The graph shows the magnetic field variation as the function of time. Assume the positive emf is the one which drives a current in the clockwise direction and seen by the observer in the direction of B. Which of the following graphs best represents the induced emf as a function of time.
Know your College Admission Chances Based on your Rank/Percentile, Category and Home State.
Get your JEE Main Personalised Report with Top Predicted Colleges in JoSA

Faraday's law states that induced emf is proportional to the negative rate of change of magnetic flux. Since B is perpendicular to the loop, flux φ = B⋅A. Thus, emf ε = -dφ/dt = -A(dB/dt).
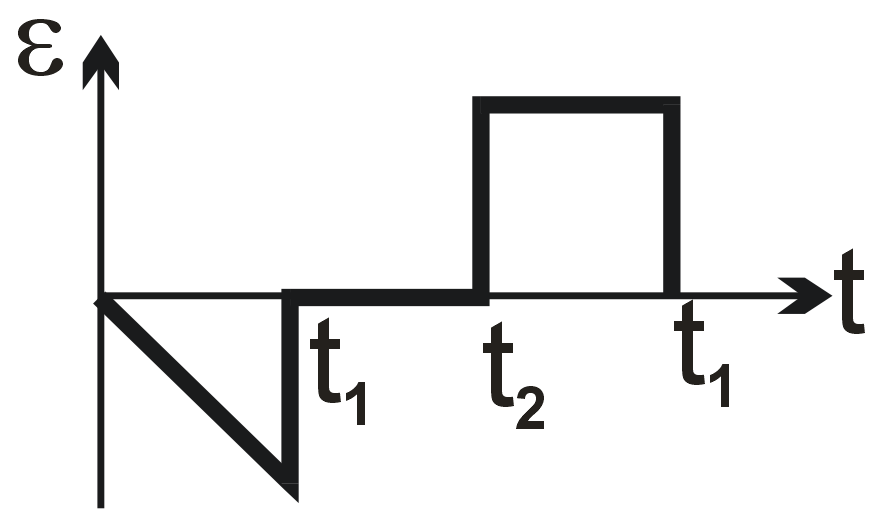
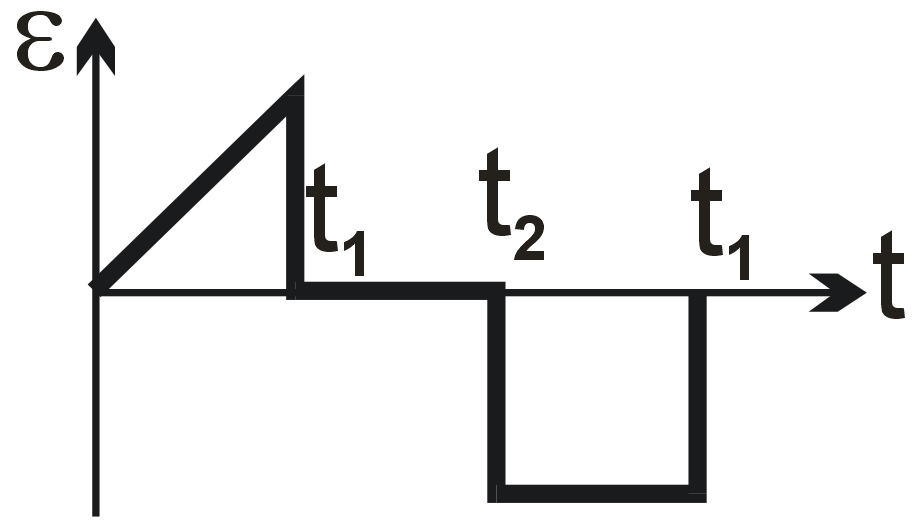
The given B-t graph has constant slopes. For 0 to T/2: dB/dt is positive and constant, so ε is negative (constant). For T/2 to T: dB/dt is negative and constant, so ε is positive (constant). The magnitude is the same in both intervals due to equal slope magnitudes.
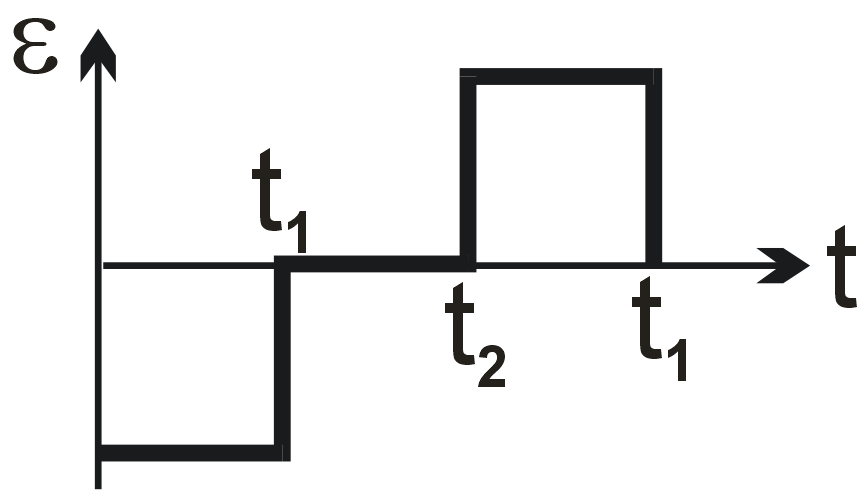
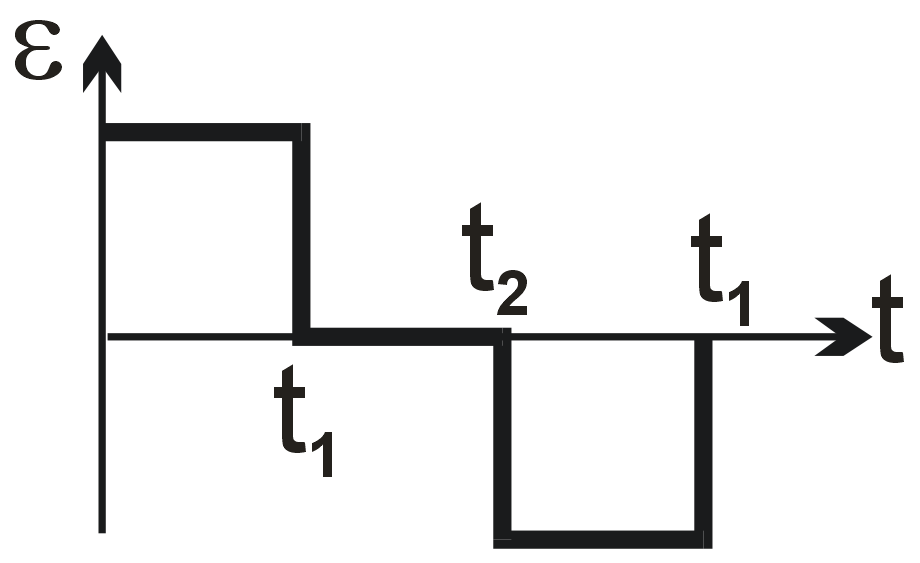
Therefore, the emf graph should be a negative constant value for the first half and a positive constant value for the second half.
Final Answer: The second graph option (square wave centered on time axis, negative first then positive).