
Question
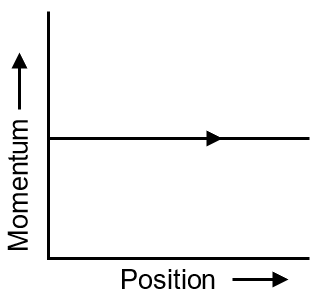
Phase space diagrams are useful tools in analyzing all kinds of dynamical problems. They are especially useful in studying the changes in motion as initial position and momentum are changed. Here we consider some simple dynamical systems in one-dimension. For such systems, phase space is a plane in which position is plotted along horizontal axis and momentum is plotted along vertical axis. The phase space diagram is x(t) vs. p(t) curve in this plane. The arrow on the curve indicates the time flow. For example, the phase space diagram for a particle moving with constant velocity is a straight line as shown in the figure. We use the sign convention in which position or momentum upwards (or to right) is positive and downwards (or to left) is negative.
Know your College Admission Chances Based on your Rank/Percentile, Category and Home State.
Get your JEE Main Personalised Report with Top Predicted Colleges in JoSA
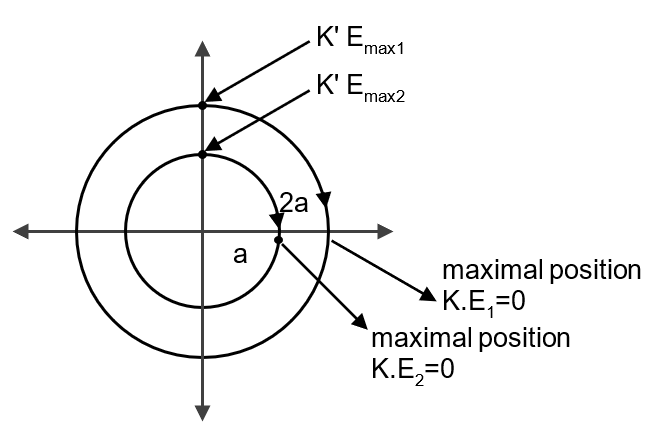
The phase space diagram for simple harmonic motion is a circle centered at the origin. In the figure, the two circles represent the same oscillator but for different initial conditions, and E1 and E2 are the total mechanical energies respectively. Then
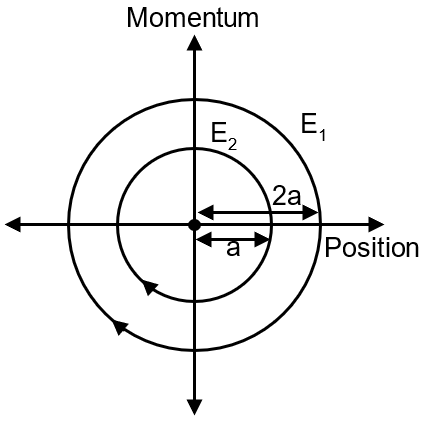
E1 = 4E2
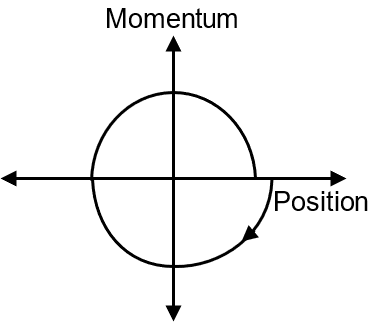
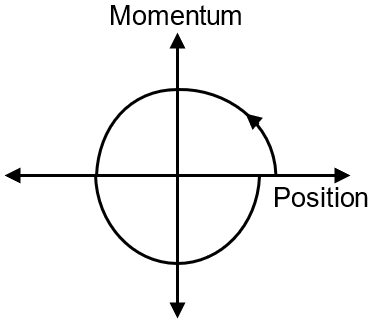
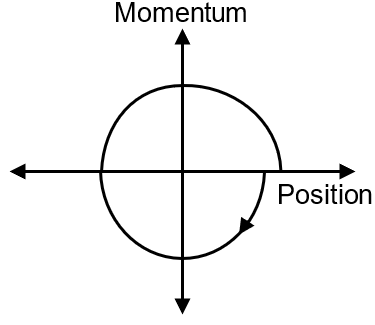
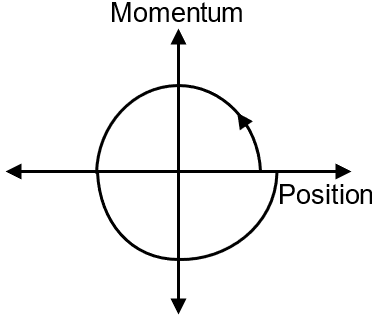
The phase space diagram for a ball thrown vertically up from ground is :
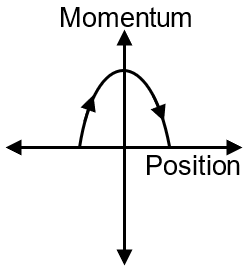
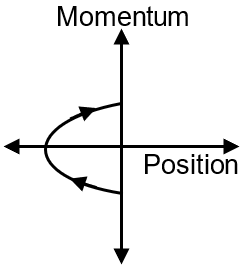
From conservation of mechanical energy
m2v2 – m2u2 = 2m2gx
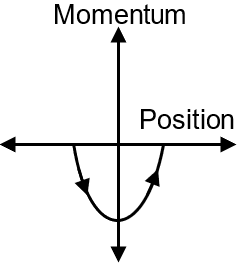
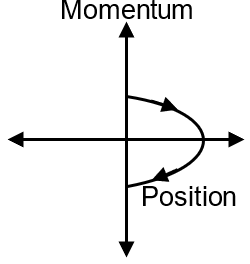
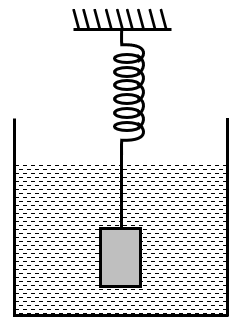
Consider the spring-mass system, with the mass submerged in water, as shown in the figure. The phase diagram for one cycle of this system is :
No Solution