Engineering
Physics
Calculus
Photoelectric Effect Einsteins Equation
de Broglie Hypothesis and Dual Nature
Question
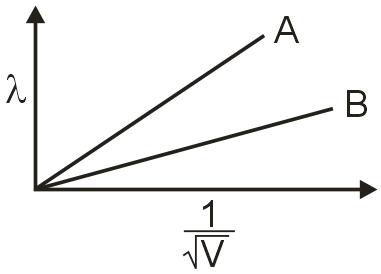
Plot a graph showing variation of de-broglie wavelength λ versus where v is acclerating potential for two particles A and B carrying same charge but of masses m1, m2(m1 > m2). Which one of the two represents a particle of smaller mass and why?
Know your College Admission Chances Based on your Rank/Percentile, Category and Home State.
Get your JEE Main Personalised Report with Top Predicted Colleges in JoSA
Solution

The de-Broglie wavelength is given by
The graph of λ vs is a straight line with slope
Since charge q of A and B is same , slope is
Since, m1 > m2
Slope of B < Slop of A
More is the slope, less is the mass, since slope of A is larger .So plot A represents smaller mass m2