
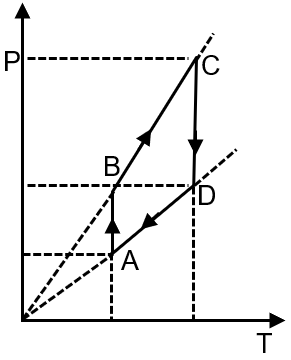
Pressure temperature (P–T) graph of n moles of an ideal gas is shown in figure.
Know your College Admission Chances Based on your Rank/Percentile, Category and Home State.
Get your JEE Main Personalised Report with Top Predicted Colleges in JoSA
The given P-T graph shows two straight lines with different slopes. For an ideal gas, the ideal gas law is , which can be rearranged to . This shows pressure is proportional to temperature at constant volume, and the slope of the P-T line is . A steeper slope indicates a smaller volume. Therefore, the process with the steeper slope (from A to B) is at constant volume V1, and the process with the gentler slope (from B to C) is at a larger constant volume V2.
Final Answer: The correct corresponding V-T graph is the second option, which shows a constant volume V1 from A to B (vertical line) and a constant, larger volume V2 from B to C (another vertical line at a higher volume).