Engineering
Physics
Graph in SHM
Energy in Prograssive Wave
Standing Wave on String
Question
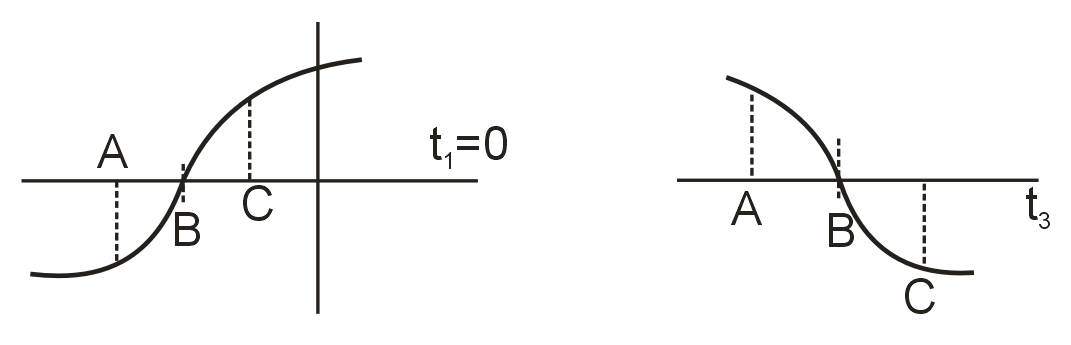
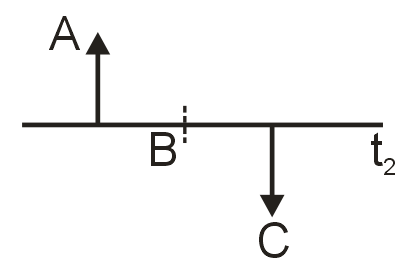
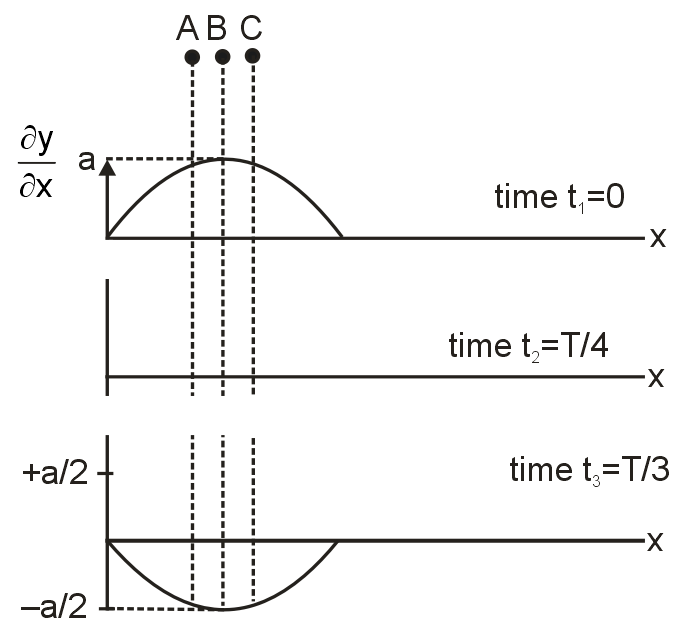
Standing wave is formed on a string and graph of slope variation Vs position is given at successive instants t1, t2 & t3 for a part of the string. A, B, C are particles on the string as shown. B. B is node and A & C are two neighboring points on 'its' two sides. The maximum value of the slope is a.
| Column - I | Column - II |
| (A) Point A, Time t2 | (P) Displacement from the mean position is upwards |
| (B) Point A, Time t3 | (Q) Displacement from the mean position is downwards |
| (C) Point C, Time t1 | (R) Displacement from the mean position has its maximum (in magnitude) possible value at that point. |
| (S) Displacement from the mean position is zero |
Know your College Admission Chances Based on your Rank/Percentile, Category and Home State.
Get your JEE Main Personalised Report with Top Predicted Colleges in JoSA
Solution

y – t graph