
The class is investigating the oscillations of a pendulum.
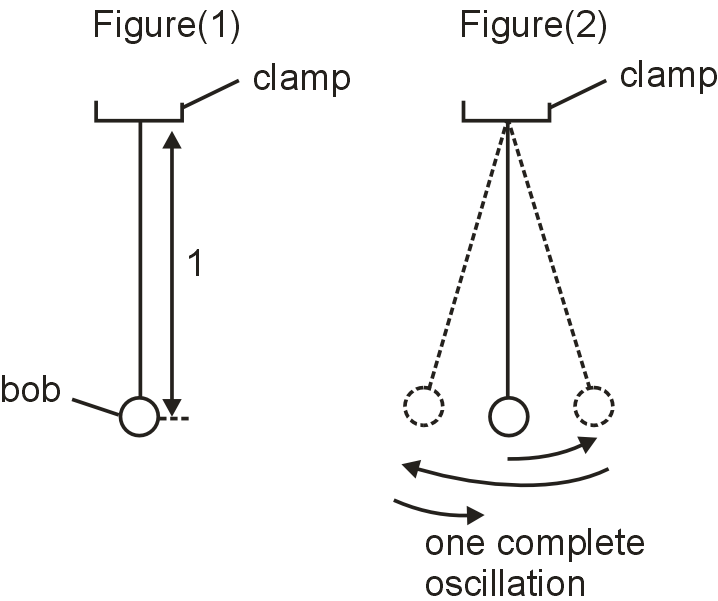
Figure show the apparatus.
A student measures the length l of the pendulum and takes readings of the time t for 20 complete oscillations. She calculates the period T of the pendulum. T is the time taken for one complete oscillation. She repeats the procedure for a range of lengths.
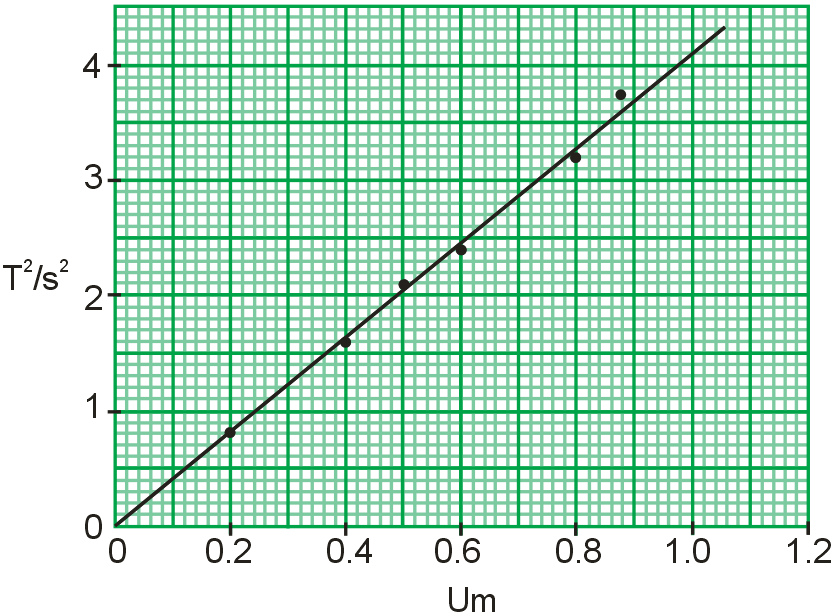
She plots a graph of T2/s2 against l / m. Given figure shows the graph.
(a) Using the graph, determine the length l of a pendulum that has a period T = 2.0 s. Show clearly on the graph how you obtained the necessary information.
(b) Explain why measuring the time for 20 swings. rather than for 1 swing. gives a more accurate value for T.
(c) Another student investigates the effect that changing the mass m of the pendulum bob has on the period T of the pendulum.
(i) Suggest how many different masses the student should use for this laboratory experiment.
(ii) Suggest a range of suitable values for the masses.
Know your College Admission Chances Based on your Rank/Percentile, Category and Home State.
Get your JEE Main Personalised Report with Top Predicted Colleges in JoSA

(a) T = 2sec