Engineering
Mathematics
Introduction to Functions
Basic Definition of Continuity
Graphs Related Problems in Function
Question
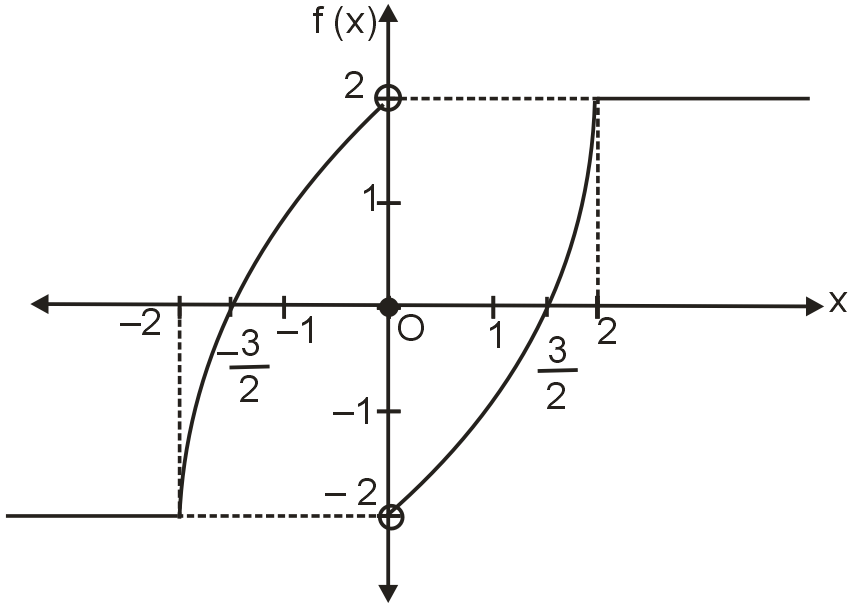
The graph of a function y = f(x) is shown in the figure. One more function y = g(x) is defined as Identify the correct statement(s)? [Note : [k] denotes greatest integer less than or equal to k]
Know your College Admission Chances Based on your Rank/Percentile, Category and Home State.
Get your JEE Main Personalised Report with Top Predicted Colleges in JoSA
Solution

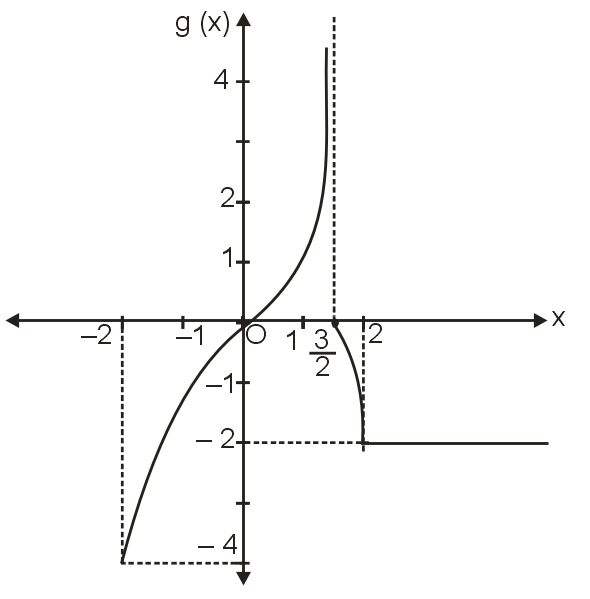
Graph of y = g(x)
From the graph it is clear that
(A) range of g(x) is [– 4, ∞)
(B)
(C) g(x) is continuous at x = 0
(D) g(x) is continuous at x =
but discontinuous at x =