
Engineering
Chemistry
Quantum Wave Mechanical Model
Question
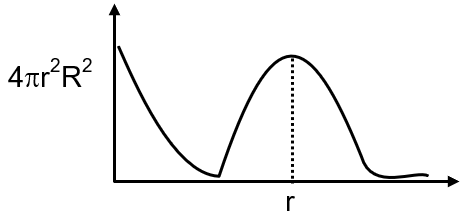
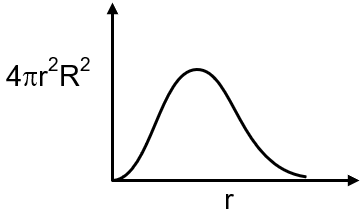
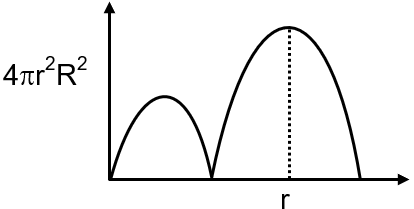
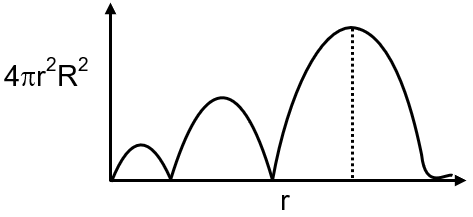
The graph representing radial charge density of 3s electron
Know your College Admission Chances Based on your Rank/Percentile, Category and Home State.
Get your JEE Main Personalised Report with Top Predicted Colleges in JoSA
Solution
The radial charge density, , for a 3s orbital has two radial nodes where the probability is zero. The graph starts at the origin, rises to a maximum, falls to zero (first node), rises to a second smaller maximum, falls to zero again (second node), and then has a final, small rise before decaying asymptotically to zero. The correct graph is the one with two distinct points where the curve touches the x-axis (r).
Final Answer: The third graph.