
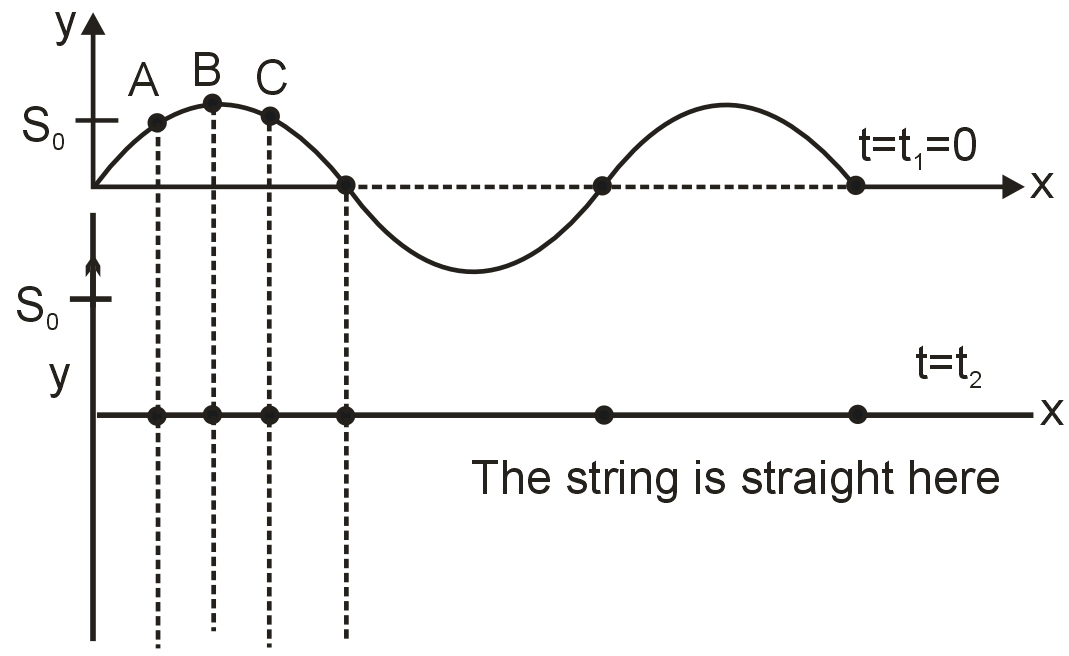
The graphs show the standing wave on a string at two successive instants of time t1,t2. A, B, C are points on the string (so is the maximum displacement amplitude of the standing wave) Column - II gives observations about net mechanical energy for the time interval between t1 & t2.
| Column - I | Column - II |
| (A) A | (P) Kinetic energy at this element is increasing. |
| (B) B | (Q) Energy is flowing towards right through this point. |
| (C) C | (R) Energy is flowing left through this point. |
| (S) No net energy ever crosses this point. |
Know your College Admission Chances Based on your Rank/Percentile, Category and Home State.
Get your JEE Main Personalised Report with Top Predicted Colleges in JoSA

In a standing wave, energy oscillates between kinetic and potential forms. Nodes (like C) have maximum kinetic energy variation but zero net energy flow. Antinodes (like A and B) have energy flow directions changing with time.
At point A (antinode at max displacement), kinetic energy is minimum but increasing as it moves toward equilibrium. Energy flows toward right (from higher to lower amplitude regions).
At point B (antinode at zero displacement), kinetic energy is maximum but decreasing. Energy flows toward left.
At point C (node), there is no net energy flow across it (energy is confined between nodes).
Final Answer: A matches P and Q; B matches R; C matches S.