
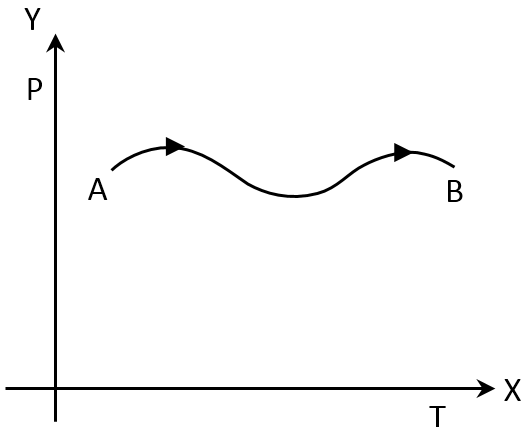
The P-T graph as given below was observed for a process of an ideal gas, which of the following statement is true?
Know your College Admission Chances Based on your Rank/Percentile, Category and Home State.
Get your JEE Main Personalised Report with Top Predicted Colleges in JoSA

Hint
Change in enthalpy, ΔH = nCPΔT
Explanation
Enthalpy change will be positive as temperature changes can never be negative.
And both the constant term is positive,
Thus,
ΔH = (+)ve
When the temperature fluctuates on this graph, the enthalpy changes as well.
Again, from the gas equation it is clear that,
V ∝ T
When the temperature rises, the volume of the gas rises with it.
W = – P (V2 – V1)
As volume increases so (V2 – V1) is positive.
So, amount of work done is positive.
Final answer
The correct answer is option (A).