
Engineering
Physics
Gravitational Force and Field
Gravitational Acceleration
Gravitational Potential Energy
Question
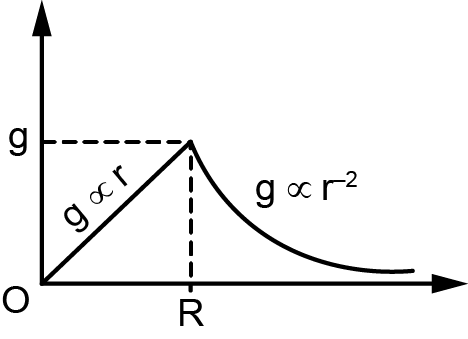
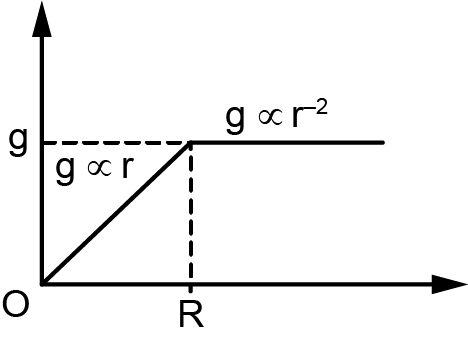
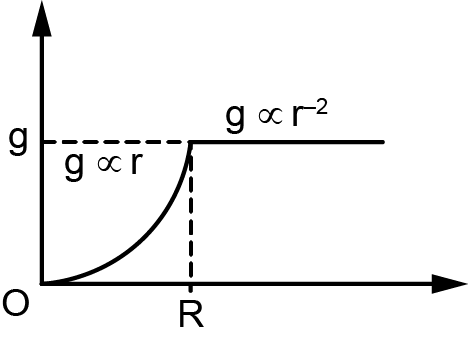
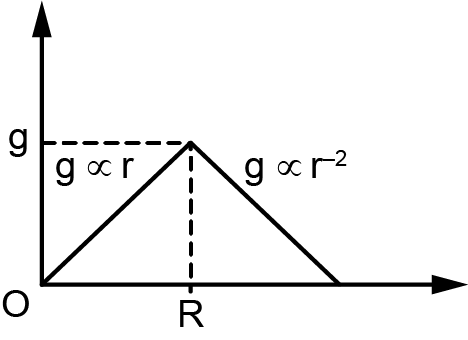
The variation of g with height or depth (r) is shown correctly by the graph in figure (where R is radius of the earth).
Know your College Admission Chances Based on your Rank/Percentile, Category and Home State.
Get your JEE Main Personalised Report with Top Predicted Colleges in JoSA
Solution

For depth: g ∝ (R − d)
For height:
Hence, the graph will be linear for depth from centre of earth (R = 0) till the surface of earth (R) and then parabolic with increase in height from earth.