Engineering
Physics
Ohm Law and Current Basics
Calculus
Forces and Types of Forces
Question
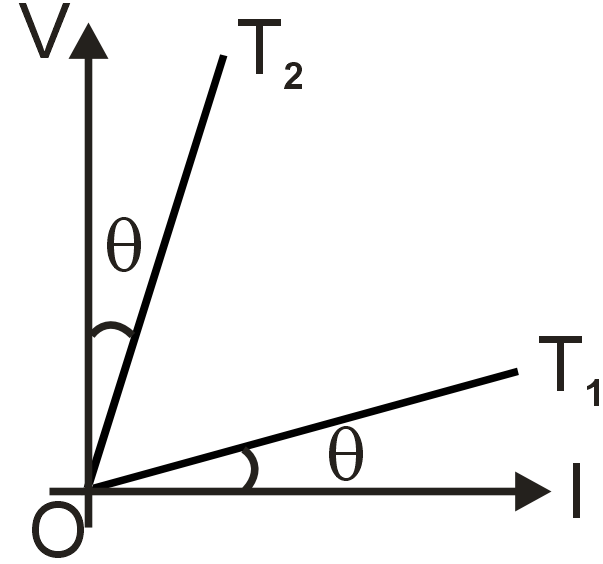
V - I graph for a conductor at temperatures T1 and T2 is as shown in figure. (T2 – T1) is proportional to
Know your College Admission Chances Based on your Rank/Percentile, Category and Home State.
Get your JEE Main Personalised Report with Top Predicted Colleges in JoSA
Solution