
Engineering
Chemistry
Gibbs Free Energy Calculations and Third Law
Question
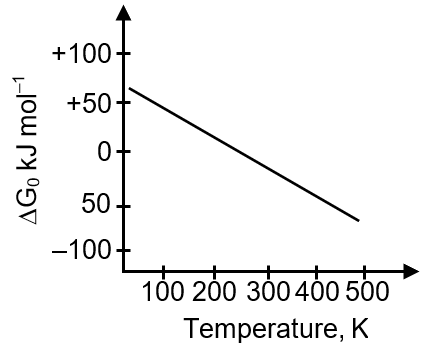
What can be concluded about the values of ΔH and ΔS from this graph?
Know your College Admission Chances Based on your Rank/Percentile, Category and Home State.
Get your JEE Main Personalised Report with Top Predicted Colleges in JoSA
Solution
The graph shows ln(K) vs 1/T, which is linear with a negative slope. This relates to the van't Hoff equation: . The slope equals -ΔH/R. A negative slope means -ΔH/R is negative, so ΔH must be positive. The y-intercept is positive, which equals ΔS/R. Therefore, ΔS must also be positive.
Final answer: ΔH > 0, ΔS > 0