
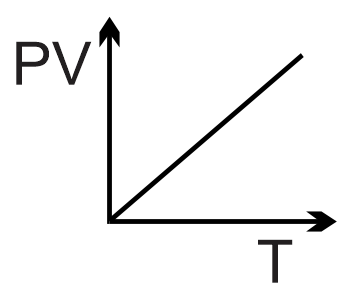
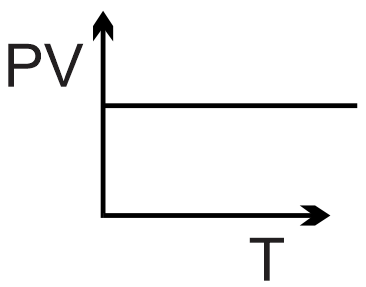
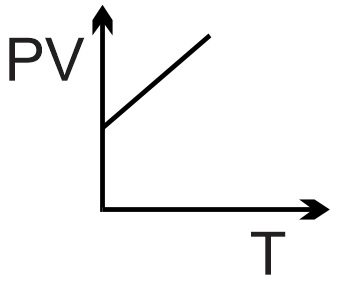
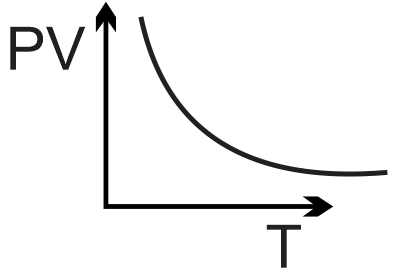
Which one of the following graphs most correctly illustrates the variation of the product (pressure×volume) for an ideal gas with thermodynamic temperature?
Know your College Admission Chances Based on your Rank/Percentile, Category and Home State.
Get your JEE Main Personalised Report with Top Predicted Colleges in JoSA

For an ideal gas, the equation of state is PV = nRT, where P is pressure, V is volume, n is the number of moles, R is the gas constant, and T is the thermodynamic temperature. The product (P×V) is therefore directly proportional to T: P×V ∝ T.
This means a graph of (P×V) vs. T will be a straight line passing through the origin (since at T=0, P×V=0). The slope of this line is nR.
The correct graph is a straight line with a positive slope starting from the origin.
Final Answer: The first graph (top-left image) is correct.